Learn how ABVA works

Everything you need to know
about ABVA Market Insights

Understand how we analyse S&P 500 stocks, calculate intrinsic value, and generate actionable market insights — so you can invest with confidence.

How it works

Get started in four simple steps

+
01

Create your account

Sign up free in seconds. Choose a plan that fits your needs — Free, Pro, or Enterprise.

🔍
02

Explore S&P 500 stocks

Browse all 500+ stocks with prices, intrinsic values, analyst targets, and ABVA rankings.

📊
03

Analyse the market

Use the analytics suite — seasonality patterns, price forecasting, macro correlations, and stock screener.

💡
04

Make better decisions

Use ABVA's Buy, Hold, and Sell signals combined with risk and valuation data to guide your investments.

Understanding the ABVA Score

How we rank and evaluate every S&P 500 stock

What is the ABVA Score?

The ABVA Score is a composite ranking that combines multiple financial metrics to evaluate each stock's investment potential. It considers intrinsic value, analyst targets, risk factors, and fundamental strength.

What goes into the score?

📊
Intrinsic valueCalculated using discounted cash flow and earnings models
🎯
Analyst targetsConsensus price targets from Wall Street analysts
⚖️
Valuation signalWhether the stock is overvalued, fair, or undervalued
🛡️
Risk assessmentBeta, debt levels, and earnings volatility
💪
Fundamental strengthROE, margins, and balance sheet quality

Recommendations

Buy

Stock is undervalued with strong fundamentals and positive momentum. Consider adding to your portfolio.

Hold

Stock is fairly valued. Maintain current position and monitor for changes in fundamentals.

Sell

Stock appears overvalued or shows weakening fundamentals. Consider reducing exposure.

Powerful analytics suite

Professional-grade tools for every investor
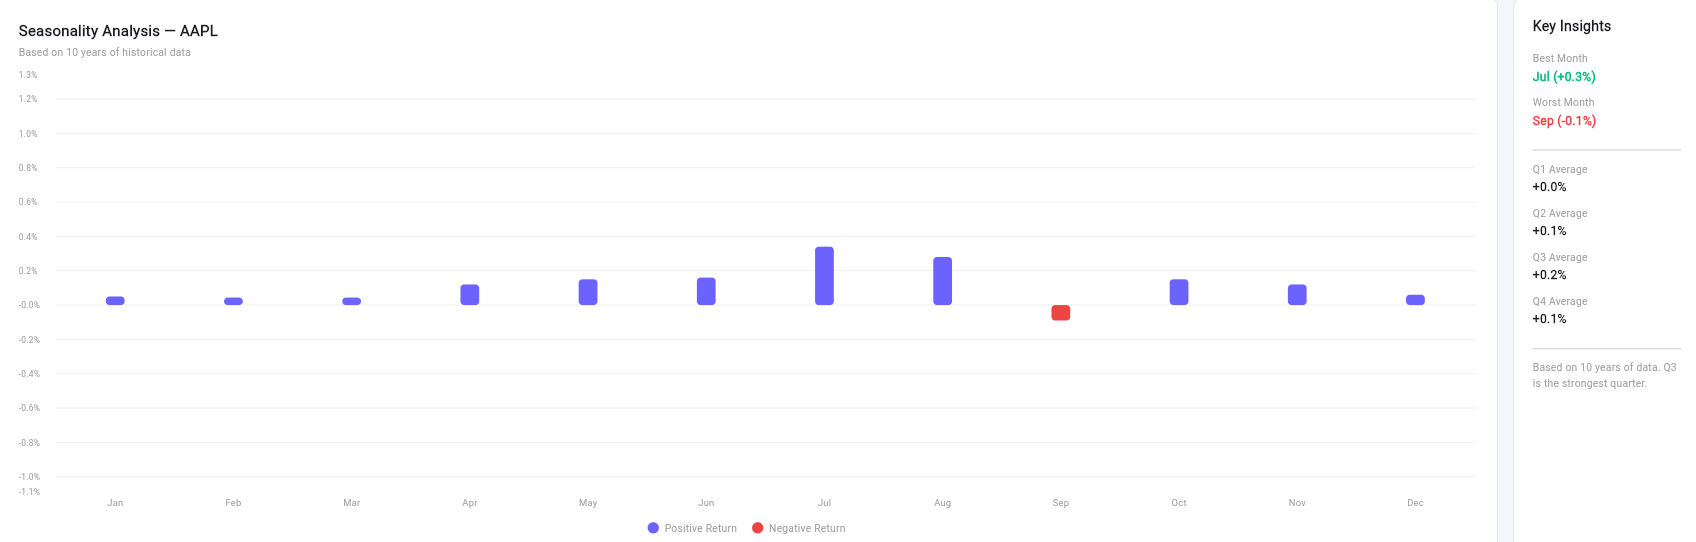
ABVA seasonality analysis showing monthly return patterns for AAPL based on 10 years of historical data
📅

Seasonality analysis

Discover historical monthly return patterns based on 10 years of data. Identify the best and worst months to hold each stock.
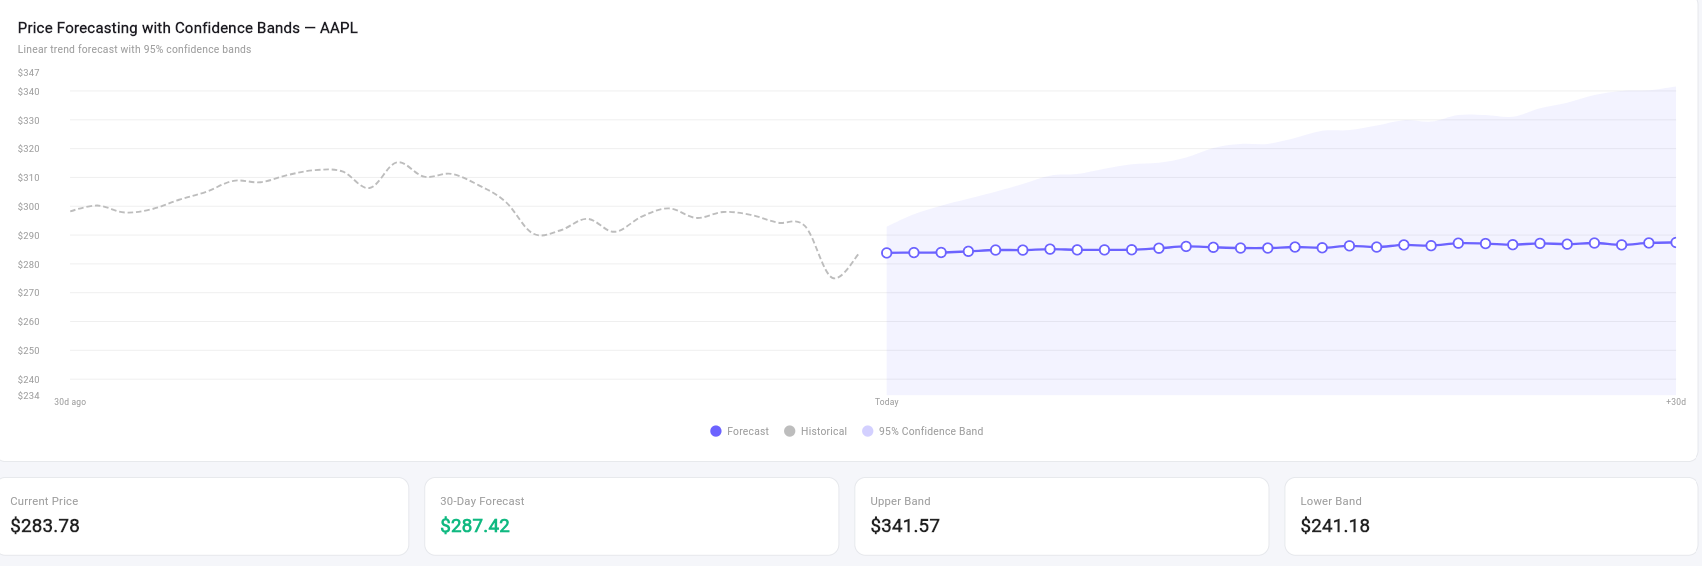
ABVA price forecasting chart with 95% confidence bands for AAPL
📈

Price forecasting

Linear trend forecasting with 95% confidence bands. See projected price ranges for the next 30 days based on recent momentum.
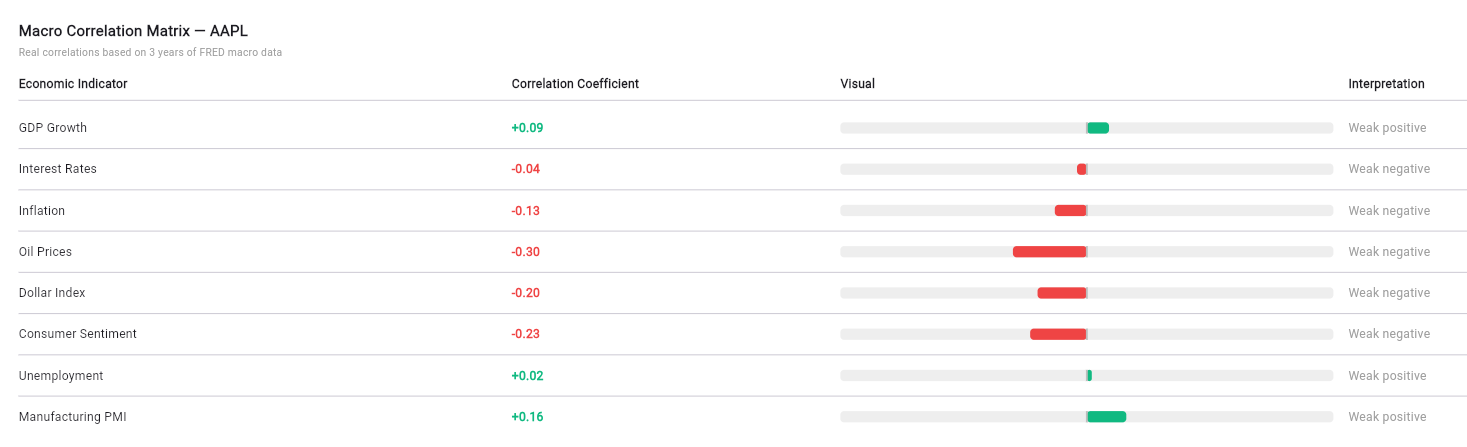
ABVA macro correlation matrix showing how AAPL correlates with GDP growth, interest rates, and inflation
🏛️

Macro correlation

Understand how each stock responds to macroeconomic indicators like GDP growth, inflation, interest rates, and consumer sentiment.
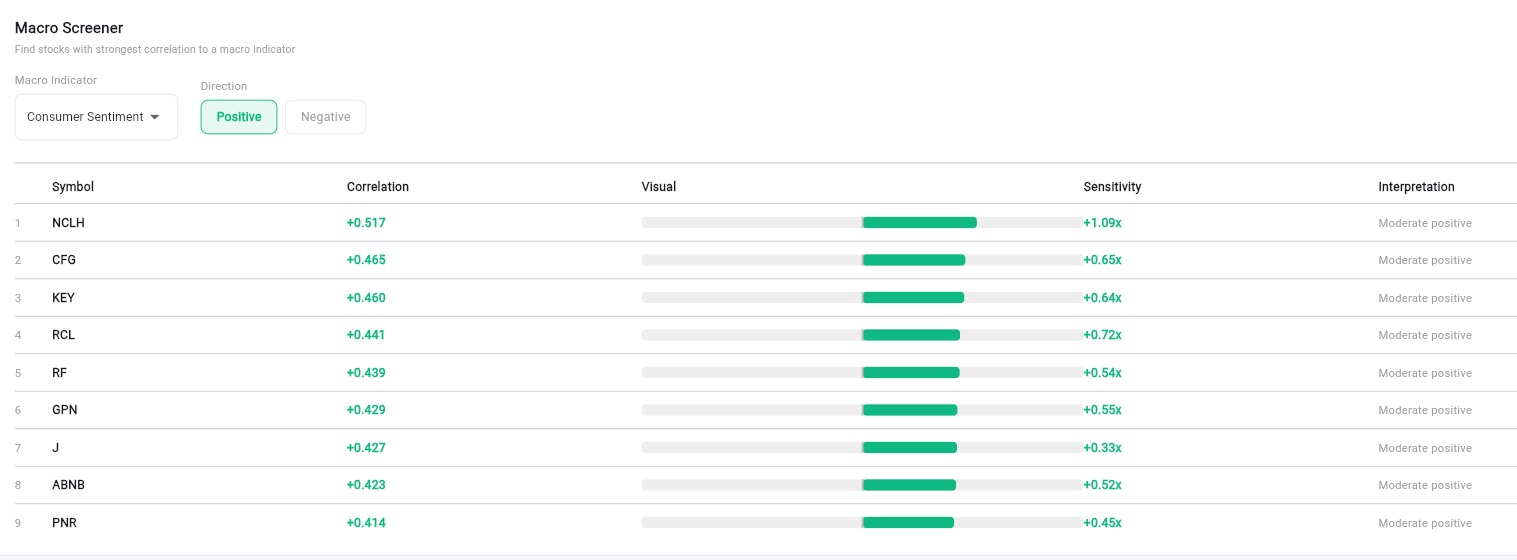
ABVA macro screener showing stocks with strongest correlation to consumer sentiment
🔎

Macro screener

Screen all 500+ S&P 500 stocks by their sensitivity to any macro indicator. Find stocks that benefit when inflation rises or rates fall.

Risk & valuation explained

Understand what each signal means for your portfolio

Overall risk

Low risk

Stable earnings, low debt, low beta. Suitable for conservative investors seeking steady returns.

Medium risk

Moderate volatility and debt levels. Balanced risk-reward profile for most investors.

High risk

High volatility, elevated debt, or uncertain earnings. Suitable for experienced investors with high risk tolerance.

Valuation signal

Undervalued

Current price is significantly below the calculated intrinsic value. Potential buying opportunity.

Fair value

Current price is close to the intrinsic value estimate. Stock is appropriately priced by the market.

Overvalued

Current price exceeds the intrinsic value estimate. Exercise caution — price may revert to fair value.

Frequently asked questions

Everything you need to know

What is ABVA Market Insights?

ABVA Market Insights is a stock analysis platform that provides intrinsic value calculations, analyst targets, and actionable recommendations for all S&P 500 stocks.

How is intrinsic value calculated?

ABVA uses a combination of discounted cash flow (DCF) analysis, earnings-based models, and analyst consensus data to estimate each stock's fair value.

What is the difference between Free and Pro?

Free users can access 20 stocks with basic dashboard features. Pro users get full access to all 500+ stocks, the complete analytics suite, and all reports.

How often is data updated?

Market data and stock prices are sourced from financial data providers and updated on a regular basis. ABVA scores and intrinsic value calculations are refreshed periodically by the research team.

What is the Macro Screener?

The Macro Screener lets you find stocks most correlated with macroeconomic indicators like GDP growth, inflation, or interest rates. It helps you position your portfolio based on the economic environment.

Is ABVA financial advice?

No. ABVA provides data and analysis tools to help you make informed decisions. It is not financial advice. Always do your own research and consult a financial advisor before investing.

How do I upgrade my plan?

You can upgrade your plan from the My Account page. Click on your avatar in the top right and select My Account, then choose your desired plan.

Stop day dreaming.
Start investing smarter.

Join thousands of investors using ABVA to make better decisions.

Get started for free